Introduction
There were no catchy way to title this article with all the info I wanted to be in there. It's going to have to be bland like that.
A big part of what we do is make sure you can get the most out of the hardware you pay for and diagnosing application efficiency issues is the first step in that.
You'll find some of the underlying theory and a few simple tools you can use to assess the situation and possible get started on the way to fix it.
Some theory
There are many possible sources of slowdowns of applications and servers, sometimes completely outside of your control.
The main thing that is under your control, is trying to limit the amount of processes waiting for CPU time.
A program is a list of processor instructions that is read from top to bottom, though it can have loops, jumps and subroutines that could make it go back up and down the instructions list.
For simplification, it's common to say that only one of these programs can run on a processor at a given time. So, if your server only has one processor, it can only run one program at a time.
Now we know that's not true, as single-processor servers can effectively run many different processes and be perfectly fine. What happens is that the Linux kernel comes with a piece of software called the "process scheduler", which is tasked with picking and choosing what program is currently running on the processor.
By pausing then swapping which process is running on the processor really fast, the kernet gives the illusion that the single processor is running multiple processes at the same time whereas in reality it's just swapping them in and out all the time.
Having to pause programs to give time to run others is not an issue either, because processors can execute an extreme amount of instructions per seconds and having to wait 20ms for a hard drive to start spinning or 50ms for a network request to end is akin to an eternity in processor time, even for old hardware. The kernel identifies when a process is waiting for IO (Input Output operation) and will immediately swap that process out for another.
In short, process scheduling works well even on a single processor because processors spend a lot of their time waiting for IO operations to end. Being able to put it to work while it's waiting is already a large effeciency improvement.
Process scheduling isn't always simple, it has to be as fast as possible (the scheduler is itself using processor time) but implement some kind of algorithm to make sure all processes on the system are given a fair share of processor time — The scheduler has to make sure everyone gets a go every now and then and it also implements systems to prioritize certain processes over others.
It gets even more complicated when more processors are involved, although the system can now obviously run more than one program at a time for real. But it's still swapping them around, in and out, to maximize processor uptime when processes are waiting for IO and to make sure every program gets an opportunity to pop up and maybe do something, or immediately yield.
Checking process wait times
When it comes to optimal processor (also called CPU or vCPU) resources, what we want to do is:
- Limit the amount of actual processing power required by the application — If we need more, we'll have to add more processor cores and make sure our application can make use of these;
- Limit the wait time for processes to get scheduled which means:
- Having a pertinent amount of CPU cores for what you're doing - Executing 10 mailing lists processes in parallel on a single core server might not be optimal;
- Limit IO operations — Network, database and storage access always means the processor will have to wait — Caching things in memory is the easiest way to lower IO.
- Paralellize certain operations by separating the IO intensive workload from almost unobstructed highspeed worker type processes — This is advanced app architecture but you could make use of pub-sub channels (using threads, Redis, Unix sockets, ...) to run almost all IO in a delayed manner. Server logging (e.g. in Apache or Nginx) is usually done that way, it's deferred while the server keeps serving requests in the meantime.
- Async/await implementations like the ones you find in .NET, Python or JavaScript usually defer IO in a very effective manner by themselves.
When there's a high load situation due to too many active processes, the average amount of processes waiting to get scheduled onto a processor or waiting for IO will increase.
That number is a commonly used kernel performance indicator called System load, which usually consists in 3 averages over different lengths of time: 1, 5 and 15 minutes.
These 3 values are visible (in that very order) in the /proc/loadavg system file:
cat /proc/loadavgAnd are also shown by the command:
uptimeA value below 1 on all the three averages is the ideal situation. However, that doesn't mean your server is badly sized or configured if you see, let's say, 5. A system load of 5 is perfectly fine for a system doing a ton of IO, for instance archiving data. The better indicator is then to check if that server is filling its role correctly — in which case the high system load is perfectly fine.
On a web server, load averages higher than 3 usually mean some kind of performance degradation of the user experience but again, that might be completely acceptable depending on your use case — Humans tend to notice total loading times of more than 1 second so that's probably what you should measure to assess user experience. A scripted API client might not care at all as long as the server responds within its timeout window.
Adding more processor cores should decrease the load average, but not always. A system that is extremely IO bound will see little improvement.
You can check how many cores your system currently has by checking the cpuinfo system file, for instance:
cat /proc/cpuinfo | grep processor | wcWhich might yield something like:
8 24 112Where the first number is the logical core count, here it's 8.
CPU cores themselves are not equal when compared between virtual server providers. Cloud provider X could be offering a 12 cores system that is equivalent to a 4 cores at Net7's for your specific use case, and that is due to virtual processors having to be scheduled to virtual machines too: you get another hidden scheduler on top of the Linux scheduler that decides if you actually get the cores at a certain time.
On top of that, CPU cores also differ in terms of hardware. But overcommitting resources can create a performance decrease that could be higher than a possible generational gain.
My point is, do not think in terms of "I know my application requires at least 16 cores" — It requires enough to do what it's tasked to do in the time it's expected to do it.
You should then ideally be able to size things up or down with configuration.
Where does the load come from?
The easiest to diagnose is when a process or group of processes is using almost all of the CPU time you have available.
Checking processes CPU usage
The top command is well known and almost always built into all the Linux destributions. I'm saying almost because some Docker containers won't have it in which case you'll have to use ps (out of scope of this article).
The top command brings up a screen that refreshes every 3 seconds with a lot of system information and a list of processes and their individual stats.
Processes that use the most CPU time appear at the top, so that's already a big help.
First of, you might want to refresh more often than every 3s as it's quite conservative for modern systems.
The "-d" argument allows providing a duration in seconds (you can use decimals):
top -d 1Will refresh every second.
Here are a few information to watch out for when top is running:
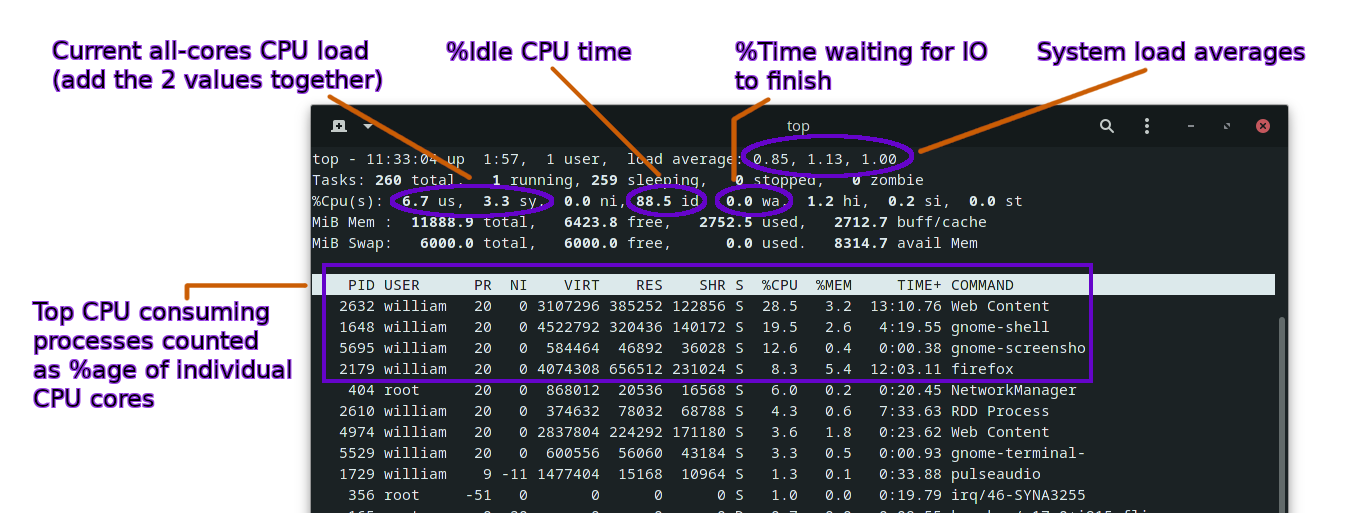
We find the system load averages that we discussed earlier, as well as the total CPU usage (all processor cores combined) and current idle %age. CPU usage is devided by default between user-space (your applications, most server software) and kernel-space (labelled "sy" for system). The process scheduler we talked about earlier is an example of kernel-space software.
Oftentimes you can just look at the user-space CPU usage since it should be much larger than the kernel-space on a fully loaded server.
We aren't talking about IO yet, but there is an instant value of the %age of time the CPU has to wait for Input/Output operations to finish. If this is close to 100%, your load issue probably doesn't come from CPU pressure.
A very low "idle" value shown by top indicates significant CPU pressure and the process list should show you where it comes from.
To see per-processor core usage, just hit the "1" key (requires shift on azerty keyboards). This helps in seeing how well the load is distributed and if you have processor cores available to run more tasks.
You should also look at swap usage, even if not highlighted on the screenshot above, as swapping is an usual source of extreme IO load but it occurs because the server doesn't have enough memory, which is a typical scenario that can snowball into a full server crash.
To quit top, hit the "q" key.
As a small extra, you can also use top in a non-interactive way, which is really useful to take snapshots of the system state and processes list, you could even do it periodically from a cronjob and that's easy forensic data for finding out strange behaviors and processes (security analysis):
top -b -n 1 > top_snapshot.txtChecking for memory pressure
Reading memory usage can be confusing on Linux because it's using a lot of memory for buffers and cache that can be freed immediately when needed and that can make it look like your server is almost filling up all of it's memory when in fact it has plenty to use.
The complete memory usage info command is:
free -hWhere "-h" stands for human readable and uses GiB on modern systems. The exact layout of what the free command shows may be slighly different according to your distribution and the version of it you're running.
For instance, my laptop show the following:
$ free -h
              total        used        free      shared  buff/cache   available
Mem:           11Gi       2.0Gi       7.7Gi       437Mi       1.9Gi       9.0Gi
Swap:         5.9Gi          0B       5.9Gi
If we ignore the "Swap" line at the bottom, we can see 7.7GiB are free, where 2GiB are used from the 11GiB total. That doesn't ad up at all.
That's because we're missing the buff/cache column that counts as used memory, except the kernel can realease it when needed. The actual column with how much memory is technically available is the "available" column at the end.
In reality this isn't always completely true, some database and IO intensive systems will suffer if they can't open relatively large buffer and cache space though that is to be determined case by case.
There are many ways to reduce memory pressure, but it's also inexpensive to upgrade your server to just have more of it.
Do I still have disk space?
Disk space sounds like an unrelated issue, but it can create situations that look like the server is overloaded when it's actually just out of storage space.
Just using:
df -hAnd checking that nothing is at 100% use (unless somehow intended) and now you know the amount of storage isn't the culprit.
You could also check that your filesystem isn't mounted read-only by checking out the line corresponding to your main filesystems in /etc/mtab:
cat /etc/mtabWhen that happens, it's usually due to mount options remounting the volume read-only when IO errors happen.
Checking for high IO pressure
We can basically split IO into two categories for simplification:
- Storage
- Network
On modern network stacks and well designed server applications your main concern would be storage IO pressure.
We've already seen a way to check for general IO pressure by checking the system load average and the immediate "wa" %age value that top shows. A high system load average with apparent available CPU time usually indicates the system is IO-bound.
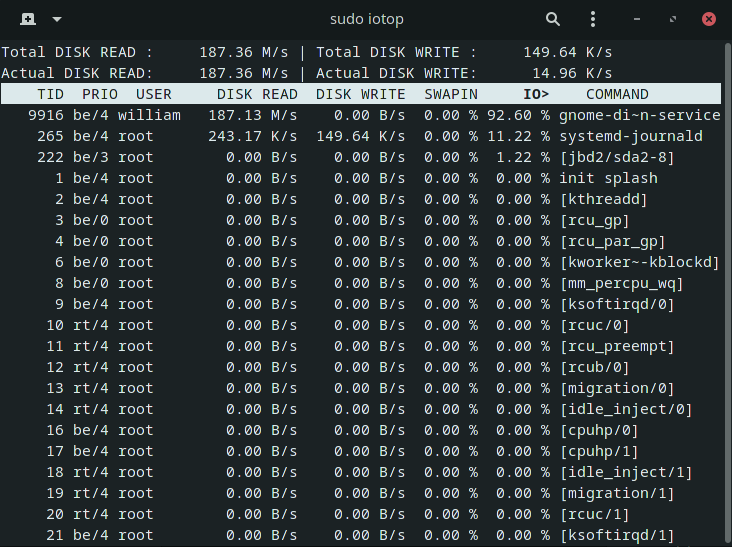
To see which processes are using storage the most, the easiest is to install an extra program called iotop.
To do so on Debian-based distributions:
sudo apt update && sudo apt install iotopYou need to run iotop with root privileges (sudo should work).
Altering process priorities
It's possible to influence how the process scheduler (we talk about it heavily in the first sections) chooses to allocate process time to different processes.
The most common way to do this is through the processes "nice" values which are used to compute the actual process "priority" value.
These two are somewhat confusing as they appear as different values in the output of top:
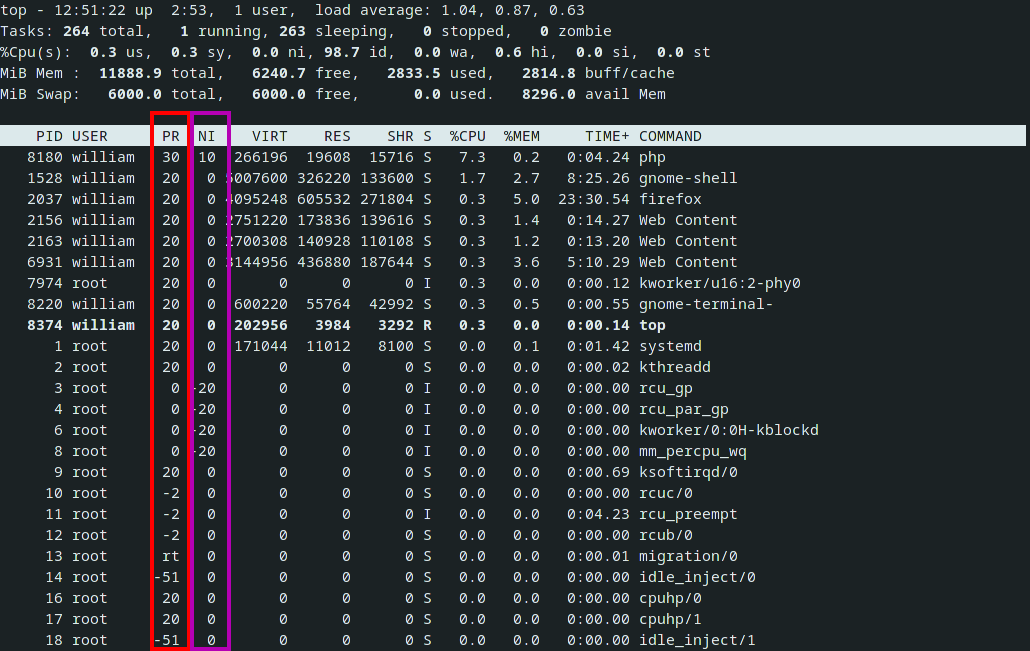
Where we have kernel process priority value in the red column, and "niceness" in the purple one.
The logic is that the kernel uses PR (priority) in its CPU time allocation algorithm, but PR is calculated using NI (niceness), usually as:
PR = 20 + NIWhere a low PR value means a higher priority and NI can be a negative value to increase process priority. In the same vein, a lower NI is supposed to increase how favored that process becomes by the scheduler.
PR effectively changes the "fairness" of how the CPU time is given to processes, but that might not be apparent depending on the situation.
If you have one process with low priority of 0, and another with the standard 20, and they both need around ~10% CPU on a single-processor system, their difference in priority won't do much because they can both run at 10% CPU at the same time and there's still processor time available for other processes afterwards.
You'd start to see the priority take effect only if the processor is close to or at 100%. In short, they become truly apparent when processes are actually fighting for CPU time.
It's important to understand that changing process priority won't solve a server being overloaded, but it might keep something vital responsive while the rest is struggling for CPU time.
The reason why we got two values doing the same thing, PR and NI, is that we can only really change NI to give priority hints to the kernel which will eventually decide the actual PR value to apply and that goes through the kernel scheduler implementation, which might be simple or more complex and has the authority to alter PR values in certain situations — E.g. it could technically decide to ignore the NI you've set.
Obviously very few people would alter the code of the Linux scheduler, but it could make sense for some very specific real-time applications. It's important to recognize that modern processors see even complex scheduling algorithm as a lightning fast tickle with literally no performance overhead but the situation could be different on some very specific hardware (e.g. old industrial control systems).
With the default niceness being 0, starting a process with a positive niceness means it's going to end up with a lower priority than the mean whereas starting it with a negative niceness will make it a higher priority process, with a maximum of -20.
Very low niceness values can be dangerous, as if that process needs 100% CPU, it will probably get it most of the time while the other processes will get scraps of CPU time and that may not be apparent at start if the process has an initial low demand in CPU time.
You should always favor trying somewhat conservative priority decreases and check the effect.
For instance, to start a big PHP batch with lower priority:
nice -n 5 php big_batch.phpOur process should end up at a PR value of 25 and will thus be made to wait for CPU time in a situation where available processor time is scarce.
If you really want to increase the priority of something, keep in mind only the root user can do this on most Linux systems.
Your command will still run but the niceness change will be completely ignored:
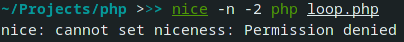
To allow users or groups or even everyone to set negative niceness values, you can usually change the setting inside of /etc/security/limits.conf.
Here's an example allowing up to -10 niceness for a specific user (your own limits.conf could look different):
#<domain>      <type>  <item>         <value>
#
william		 -	 nice		 -10
#*               soft    core            0
#*               hard    rss             10000
#@student        hard    nproc           20
#@faculty        soft    nproc           20
#@faculty        hard    nproc           50
#ftp             hard    nproc           0
#@student        -       maxlogins       4

# End of file
You will need root priveleges to alter these values and a reboot to apply them.
Changing the priority of a running process
The nice command can only alter priorities of new processes. There is another command for existing processes called renice.
Its usage is very similar to nice except you have to specify a process id, user or group on which to apply the new niceness value.
Basically:
# Change nice value to 5 for a running process:
renice -n 5 -p <PID>

# Change nice value to 5 for all running processes for a user:
renice -n 5 -u <USERNAME>

# Same thing for a group (requires the group ID):
renice -n 5 -g <GID>
How to use process priorities to help with high load situations
Usually you will want to increase the niceness (and thus decrease the priorities) of batch processes, like cronjob, database consolidation jobs, newsletter sending batch, etc.
When you have looping batch processes or daemons, it's interesting to introduce a configurable wait time between loops in the code so that you can manually slow these processes down without having to touch their kernel priorities.
If that doesn't help, you have to identify whether you could benefit from adding more processor resources, or if something else is bottlenecking — for instance, IO.
Applications that provide a web server should be prioritized as web clients do not wait forever for a response and will timeout at some point.
Also, having many open connections waiting for data will increase general IO pressure on that server.
Conclusion
We hope this article helped understanding some OS concepts and determining where a perceived slowness might come from.
The analysis can be much more complex and we'll always be willing to help our customers with improving general infrastructure performance and providing advice on getting the most out of what they pay for.
We haven't touched on that, but adding multiple processor cores is usually referred to as vertical scaling whereas adding more servers/instances/nodes (depending on the jargon) is called horizontal scaling — Both can help with a high load situation with varying degrees of complexity.
Caching is extremely important when applications grow — Many Java or .NET applications use in-memory simple data structures (E.g. a Hash Map) to cache a lot of information and prevent having to read from the disk or network — There are other ways to introduce a caching layer to applications and it might become the main determinant of application performance in some cases.
Finally, there are tools for load testing that we can use to anticipate or determine bottlenecks.