Introduction
When we recently wrote about basic Linux server performance assessment we left in the air that network activity is sometimes the sole reason adding more processor cores doesn't help your system to be more reactive.
Using sockets for network communication incurs long wait times for processors.
In this article we'll try to present a few tools to diagnose the network activity on a Linux machine. These are also very useful to try and find out if there are processes on your system that you don't know about that are hogging resources and shedding unwanted information — By which we mean it's useful to uncover suspicious activity and malware.
The netstat command
Let's talk about netstat first. It's probably the oldest network connection diagnostic tool and is available on most operating systems, including Windows, although the command line arguments may vary.
It's considered "obsolete" by some for reasons that will be discussed later (see the section about ss) but the prevalence of the tool, even on very old Linux kernels, makes it a reference still.
How does it work?
On Linux, most things are handled as files. Network sockets are no exceptions, as are processes handles.
To show network connection statistics, netstat opens pretty much all of these descriptors from /proc and onwards, collects the information and displays it as a table.
Since the tool is just reading a bunch of files and directory, it could be tampered with in a few ways to try to prevent it to show you malware activity, for instance.
There are various ways to that end which are out of scope of this article.
Our advice would still be to run it as root (prepending with sudo does it) so that you can see every running processes on the system (some may be hidden to non-root users) and possibly verify consistency with the output of the ss command we describe later.
Most common use cases - netstat cheat sheet
Let's cut things short for once and list what we feel are the most useful command line arguments for netstat with no other command or utility involved.
I don't think anyone ever uses netstat with no arguments. What it shows in that case are all the TCP, UDP and RAW active sockets (except it doesn't show the entries in LISTEN status) as well as a large amount of unix sockets which have a much lower IO cost and are usually of no interest to our diagnosis efforts.
A good starting point would be:
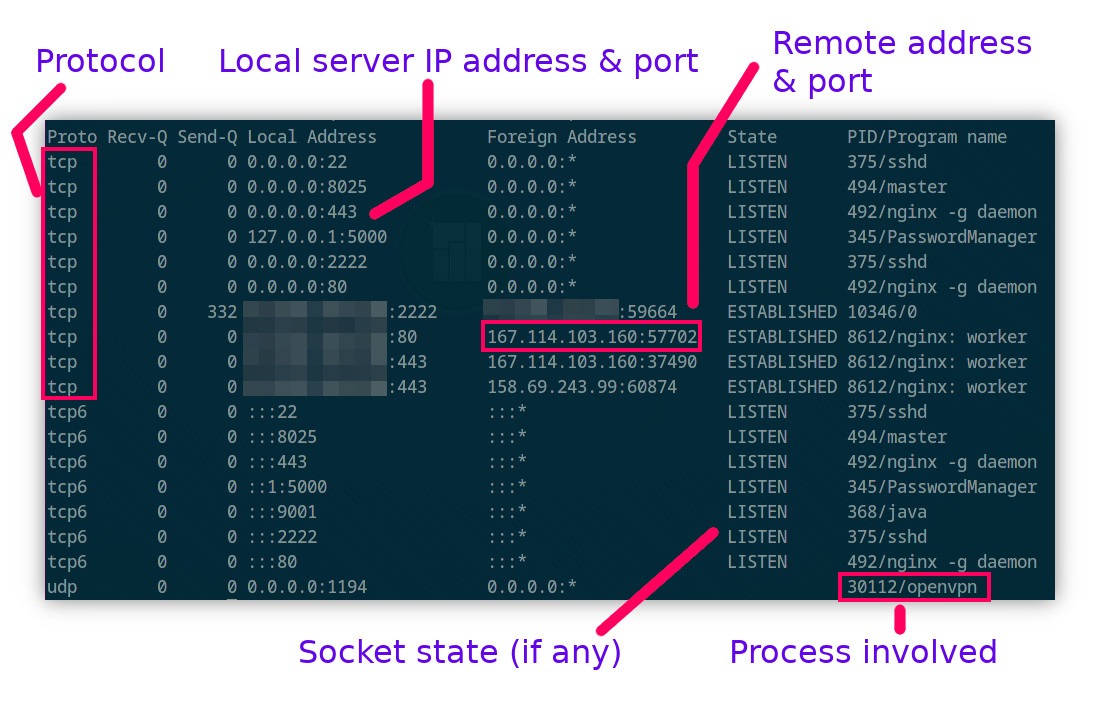
netstat -tunpaWhere:
- t selects TCP info
- u selects UDP info
- n disables reverse DNS checks and replacing well known ports by text (as in :80 becomes "http") — Makes the command run faster
- p Also fetch and show process information, as in which process owns that socket
- a Also lists the sockets in LISTEN status — You should find all your server apps like Nginx or Apache having one of these lines
In which you can famously reorder the arguments to make it sound easier to remember to you.
Which would yield what we'd argue is a very easy to understand table:
In many cases you can remove the -a option and leave it as
netstat -tunpAs there's often little interest in sockets in LISTEN state — We're more interested in seeing how many and what kind of clients are connected to sockets to identify trends and even for malware hunting as they almost always use reverse shells which means the malware is not listening to a port, it's connecting to a known remote command and control server.
Now if you want to list all the listening sockets at once and only that, this is what you want:
netstat -ltupContinuous output
The -c option makes the output continuous as if you were entering the command again and again (every second).
It's useful as a builtin way to continuously look for something specific or watch for activity — although you'd usually have to pipe the output into other commands (e.g. grep or awk) to make it smaller.
Filling in for ifconfig and route
Kind of a weird use case but netstat can also do what the route and ifconfig commands do, as they all read the same system files.
Displaying network interface info and stats:
netstat -ieShowing the routing table:
netstat -rnIn combination with other commands
This is mostly just food for thought as command line wizardry knows no bounds and I won't pretend to be very good at it.
The most obvious partner for netstat is grep as always:
netstat -tnp | grep ":80"Where we want to check all the connections to port 80 (I'm aware that ports in the 8000 will also match — This article is already too long to be a course about grep).
Listing all connected IP addresses:
netstat -tunp | awk '{ print $5 }'We're basically cutting the 5th column, something you could also do with cut.
A classic for high trafic servers, checking how many TCP connections handles exist:
netstat -tn | wcThe first number in the output is the amount of lines in the output of netstat and thus should be the amount of connections (or very close to it).
It's often very useful to check where some IP addresses come from, for which you have the whois command, available in most distributions, or online tools to check with existing IP address databases.
Using netstat on Windows
All versions of Windows should also have netstat but it's using different command line arguments than its UNIX counterpart.
The following command is what you want most of the time:
netstat -aobOn Windows the feature to have netstat output continuously is built into the command options directly, as in:
netstat -aob 1Will refresh every 1 second.
Its successor: ss
The ss command shows socket information, pretty much like netstat does, with the key difference that it doesn't read /proc/net/* special files and uses a "newer" (it's actually very old) kernel API instead.
It's considered harder to tamper with and is faster which is actually a big reason to use it on servers that are already crawling under very large amount of IO operations as the difference in speed can really be significant in not making the high load situation worse on your server.
If you have strace installed, you can see these system calls when invoking netstat:
openat(AT_FDCWD, "/proc/net/tcp", O_RDONLY) = 3
openat(AT_FDCWD, "/proc/net/tcp6", O_RDONLY) = 3
Whereas ss opens a special socket for kernel diagnostic information.
The good news is we can pretty much use it with the same options as netstat. For instance:
ss -tunpWill show every TCP and UDP connection. You can add the -l option to show the listening sockets or use -a to show everything, exactly as you would with netstat.
Extra: quickie about lsof
The lsof utility shows all the currently ative file handles on the system.
As you may probably know by now, Linux sockets are all files that follows about the same rules as your regular file when it comes to opening them to read and/or write etc.
As a result of that, we can use lsof to track network connections too.
The basic usage would be to ask for all the handles that exist on some file, as in:
lsof /some/file
But you can also ask for all the handles owned by a specific process ID:
lsof -p <PID>Alternatively, using the name of the process if you don't want to bother with PIDs:
lsof -c <COMMAND_NAME>Another classic for forensics, listing all the handles owned by a system user:
lsof -u <USERNAME>There are a bunch of specific things you can do related to sockets using the helper option "-i":
lsof -i :80
lsof -i tcp
lsof -i udp
lsof -i@<IP_ADDRESS>
Where we respectively list sockets for port 80, TCP, UDP or everything related to the provided IP address.
These are very useful to recoup what netstat is telling you and possible have an easier time isolating what specific processes are doing.
iftop
The iftop utility displays real time socket information for a specific network interface, including digesting the data transfer information in human form.
You have to install it first as iftop isn't a default package on any distribution I know of. It's also obiously using more resources than netstat or the lighter ss.
As things tend to move fast, we usually prefer using ss or netstat but the impression of volumes being transfered is much clearer with iftop and that can be useful in some situations.